This page contains all the sources and more information about my lecture at the ETH from November 27, 2019.
The video is here: http://www.video.ethz.ch/events/2019/nordborg
A PDF-Version of the presentation is available here:
A huge thanks to Patrick Chappatte and Chris Madden for allowing me to use their cartoons.
Slide 1: Intro

The cartoon of a man devouring the Earth was provided by Chris Madden.
Slide 2: What do we tell our children?

The cartoon by Justin Bilicki was the winner of the UCS Science Idol political cartoon contest in 2008.
The quote is from “The Jungle” by Upton Sinclair .
Slide 4: Exxon 1982 – It was never about science
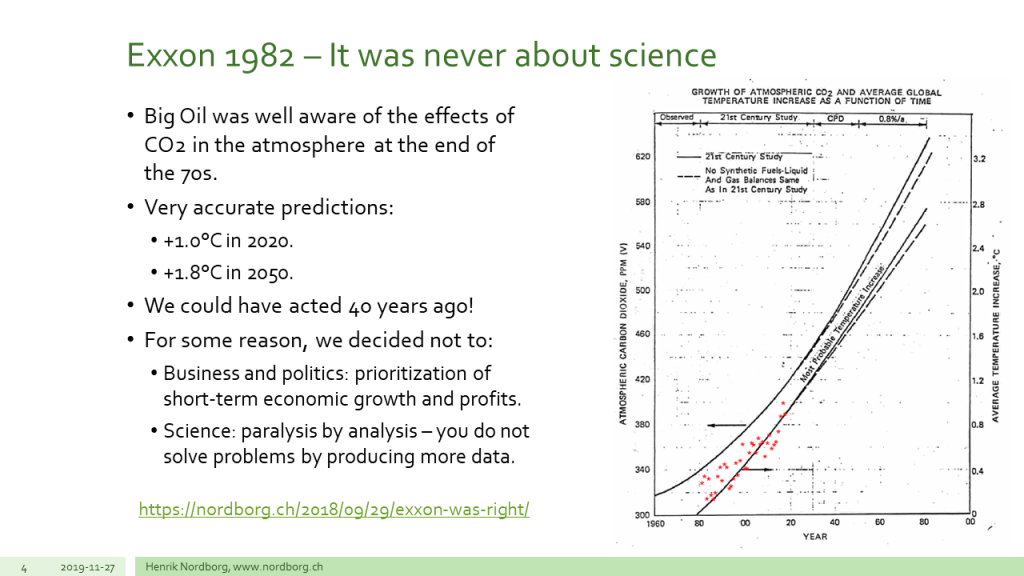
I published this story on my blog: https://nordborg.ch/2018/09/29/exxon-was-right. It was based on an article in The Guardian. I simply added actual temperatures to the plot to show that the trend is reasonably correct.
Slide 5: The Keeling curve – CO2 in the atmosphere

The data for the Keeling curve is publicly available from the Scripps Center of Oceanography. The site contains a lot of useful information. The inspiration to the plot came from the Open Mind Blog. and the analysis and visualization was done in Matlab.
Slide 6: CO2 increase caused by emissions

In addition to the Keeling data, the plot uses data on global carbon dioxide emissions from BP Statistical Review of World Energy.
Slide 7: What about risk?

The IPCC Special Report on Global Warming of 1.5°C gives the following numbers for the CO2 budget at the start of 2018:
| Probability | Budget |
| 67% | 420 Gt |
| 50% | 580 Gt |
The budgets decrease by roughly 40 Gt annually. Using the differences between these two budgets to estimate the the standard deviation, we obtain σ = 370 Gt. A 95% probability corresponds to 1.28 σ or 610 Gt, which significantly exceeds the remaining carbon budget.
Slide 8: IPCC emission paths

The graph of the emission scenarios is taken from:
Fuss, Sabine; Canadell, Josep G.; Peters, Glen P.; Tavoni, Massimo; Andrew, Robbie M.; Ciais, Philippe et al. (2014): Betting on negative emissions. In: Nature Climate change 4 (10), S. 850–853. DOI: 10.1038/nclimate2392.
The latest United Nations report can be found here: Press Release.
Slide 9: Where are we heading?

The diagram with emission pathways compatible with 1.5 degrees is from IPCC Special Report on Global Warming of 1.5°C
IPCC, 2018: Summary for Policymakers. In: Global Warming of 1.5°C. An IPCC Special Report on the impacts of global warming of 1.5°C above pre-industrial levels and related global greenhouse gas emission pathways, in the context of strengthening the global response to the threat of climate change, sustainable development, and efforts to eradicate poverty [Masson-Delmotte, V., P. Zhai, H.-O. Pörtner, D. Roberts, J. Skea, P.R. Shukla, A. Pirani, W. Moufouma-Okia, C. Péan, R. Pidcock, S. Connors, J.B.R. Matthews, Y. Chen, X. Zhou, M.I. Gomis, E. Lonnoy, T. Maycock, M. Tignor, and T. Waterfield (eds.)]. World Meteorological Organization, Geneva, Switzerland, 32 pp.
The forecasts from BP are taken from the BP Energy Outlook:
https://www.bp.com/en/global/corporate/energy-economics/energy-outlook/carbon-emissions.html
Slide 10: BP: An Unsustainable Path

Press release from BP:
Slide 11: BP Statistical Review of World Energy

Speech given by Spencer Dale, BP group chief economist
Slide 12: Climate Crisis!

There is no lack of books, newspaper articles and research papers describing the climate crisis. Here is a short list of references:
- David Wallace-Wells, The Uninhabitable Earth: A Story of the Future.
- Jonathan Franzen, What If We Stopped Pretending, The New Yorker.
Slide 14: The Economist – Unburnable Fuel

The article by the economist can be found here: https://www.economist.com/business/2013/05/04/unburnable-fuel.
A very important article, which introduced the idea of the carbon budget, was written by Bill McKibben and published by the Rolling Stone Magazine in 2012:
Global Warming’s Terrifying New Math, RollingStone, July 19, 2012.
Slide 15: The Solution?

Donald Trump has received enough media attention.
Slide 16: Global Energy Consumption

Data copied from BP Statistical Review of World Energy.
Slide 17: The World Economy is Driven by Fossil Fuel

GDP data from the World Bank: data.worldbank.org.
CO2 data from carbonbrief.org:
Slide 18 & 19: GDP And CO2: Current Policies

Using the same data as above.
Slide 20: Is Decoupling possible? – Exhibit A

Isaksen, Elisabeth T.; Narbel, Patrick A. (2017): A carbon footprint proportional to expenditure – A case for Norway? In: Ecological Economics 131, S. 152–165. DOI: 10.1016/j.ecolecon.2016.08.027.
Slide 21: Is Decoupling possible? – Exhibit B

Ward, James D.; Sutton, Paul C.; Werner, Adrian D.; Costanza, Robert; Mohr, Steve H.; Simmons, Craig T. (2016): Is Decoupling GDP Growth from Environmental Impact Possible? In: PloS one 11 (10), e0164733. DOI: 10.1371/journal.pone.0164733.
Slide 22: Is Decoupling possible? – Exhibit C

Hickel, Jason (2019): The contradiction of the sustainable development goals: Growth versus ecology on a finite planet. In: Sustainable Development 145 (6), S. 10. DOI: 10.1002/sd.1947.
Slide 23: The need for Degrowth – a simple proof

References are not required, as the argument is obvious. There are many different estimates of the payback time in the liteture.
Slide 24: IEA World Energy Outlook 2019

Slide 25: The Truth Behind the Climate Pledges

Slide 26: It simply won’t happen

Slide 27: Do you also want to eat?

Slide 28: Water Stress

Slide 29: We have been asking the wrong question for 40 years

Slide 30: Windpower for Advertising?

Slide 31: Why are we still using GDP?

Slide 32: The Social Progress Index

Slide 33: Destroying the planet out of boredom

Slide 34: Obfuscation with money: the Kaya equation

Slide 35: Forget the money, it’s about resources!

Slide 36: A simpler and better (Kaya-)equation

Slide 37: Question: Why do gold diggers get rich?

Slide 38: Design for Destruction?

Slide 39: Galileo vs. the Catholic Church

Slide 40: You can’t have your planet and eat it!

Slide 41: Collapse of Complex Societies – Tainter

Slide 43: Global Carbon Compensation

Slide 44: Managing the Commons

Slide 46: Have we reached the political point of no return?

Slide 47: Consumer Strike: Pulling the Emergency Brake

Slide 48: Consumer Strike

Slide 49: Consumer Strike
Slide 49 & 50: We need to stop pretending …


Slide 51: Cheer up! We can still fix this!
